


Measuring AI Mapping Performance
How We Evaluate Unit Detection, Identification and Classification
MapScale® is on a mission to transform AutoCAD-style floor maps—whether in DXF, DWG, or PDF format—into rich, usable GeoJSON files by automatically detecting, classifying, and identifying elements like walls, units, and furniture. But how do we know how well MapScale®, our proprietary AI Mapping engine, performs? To answer that, we’ve developed a clear and robust way to measure its accuracy, focusing on three key tasks:
|
|
|
|
|
#1 Detection Measures the model’s ability to identify spatial elements (e.g., walls, doors, POIs) and their boundaries. |
#2 Classification Evaluates the accuracy of categorizing architectural elements (e.g., meeting-space vs. work-space). |
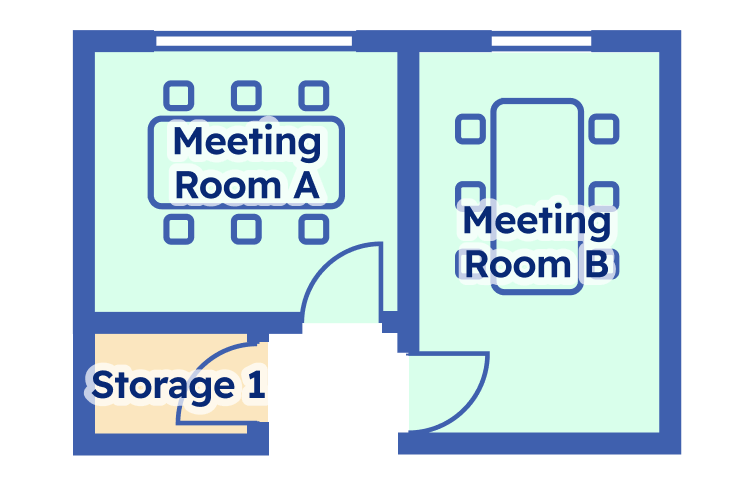
#3 Identification Extracts and identifies all available metadata from floor plans — including unit names, IDs, and annotations (e.g., Meeting Room A by the exit vs. Meeting Room B by the window). |


For our benchmark, we’ve chosen the F2 score as our primary metric—a balanced way to evaluate both tasks that prioritizes finding as many units as possible while keeping errors in check.
Unit Detection
For unit detection, we’re interested in whether MapScale® can locate every unit on the map. We compare its output to a “ground truth” version of the map—think of it as the perfect answer key, carefully prepared by humans. A unit is considered a true positive (TP) if MapScale® detects it in the right spot, no matter what label it assigns. If MapScale® misses a unit that’s in the ground truth, that’s a false negative (FN). And if it marks something as a unit that isn’t really there, that’s a false positive (FP). We then calculate precision (how many of MapScale®’s detected units are correct) asPrecision = TP / (TP+FP), and recall (how many of the real units MapScale® found) as Recall = TP / (TP + FN). Since missing a unit is often more costly than an extra detection in map digitization, we use F2 score, one that weighs recall higher. This gives us a single number that reflects MapScale®’s ability to detect units reliably.
F2 Score
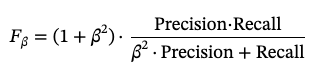
F2 score is a specific case of the Fβ score (F-beta score) with β = 2. The Fβ score is a weighted harmonic mean of precision and recall, where β controls the balance between precision and recall, giving more weight to recall when β > 1.
The general formula for the Fβ score is:
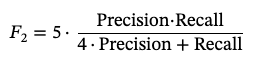
For the F2 score (where β = 2), substitute β = 2 into the formula:

Unit Classification
For unit classification, we take it a step further: not only does MapScale® need to find the unit, but it also has to classify it correctly (e.g., “work-space” instead of “lab”). Here, a true positive requires both a correct detection and the right label. False positives include detections with wrong classes or extra units that don’t exist, while false negatives are still the units MapScale® misses entirely. We compute precision, recall, and the F2 score same way, but now the bar is higher because classification errors count too. To get an overall picture across all unit types—like workstations, kitchens, or storage spaces—we combine the results by totaling up all true positives, false positives, and false negatives across the classes, then calculate one unified F2 score. This approach ensures MapScale®’s performance reflects how it handles the full variety of units in a floor map.
Unit Identification
Lastly, unit identification ensures that detected and classified units maintain identity consistency, matching specific attributes like name and IDs between ground truth and predictions using string similarity (e.g., Levenshtein distance). For this task, we measure accuracy by calculating the ratio of units with correctly labeled names and IDs to the total units in the ground truth. To account for minor variations in names, we use fuzzy matching based on Levenshtein distance, ensuring that small differences—such as "Tea Room" vs. "TeaRoom"—are not considered incorrect. However, since IDs are a more precise, quantitative metric, we require an exact match, where any discrepancy is counted as an incorrect label.
Name Matching:
Convert both names to lowercase and compute their similarity using Levenshtein distance. If similarity exceeds a predefined threshold, count it as a match (name_score).
ID Matching:
If both IDs exist and match, count it as a correct identification (id_score).
Final Score Calculation:
Compute average scores for name_score and id_score.
Return a combined identification score along with total comparisons.
Conclusion
By leveraging these evaluation metrics, MapScale® ensures high-quality unit detection, classification, and identification. The F2 score serves as a robust measure, prioritizing recall while maintaining precision, thereby reflecting our commitment to accuracy in automated floor map digitization.
Can Tunca is the Chief Research and Development Officer at Pointr, where he leads an R&D team of 10 in pioneering AI-driven mapping technology. Under his leadership, Pointr has developed the world’s first AI mapping engine, leveraging LLMs and Computer Vision. Can holds a PhD in Computer Science from Boğaziçi University, one of Turkey’s most prestigious institutions.